Author: azeeadmin

27 Feb 2019

FTC brings its first case against fake paid reviews on Amazon

The Federal Trade Commission announced on Tuesday evening that it has brought its first case against using fake reviews to sell products online. The Commission said it will settle with defendant Cure Encapsulations Inc., a New York City-based company, and owner Naftula Jacobwitz, who it accused of making false claims about a weight loss supplement and paying a third-party website to post fake reviews on Amazon.

Fake reviews are a constant nuisance for Amazon shoppers, despite algorithms designed to safeguard its review system, and the company has hit back with a series of lawsuits against websites that offer to post fake verified reviews.

According to the FTC’s complaint, Cure Encapsulations sold pills with garcinia cambogia, a tropical fruit also called brindleberry that is sometimes used as a “natural” weight loss aid. Called Quality Encapsulations Garcinia Cambogia, the pills were sold only on Amazon. Jacobwitz paid a website called www.amazonverifiedreviews.com to post favorable reviews in order to boost its rating.

An exhibit from the FTC’s complaint against Cure Encapsulations Inc.

On October 8, 2014, Jacobowitz sent an email to the site’s operator saying he’d pay a total of $1,000 for 30 reviews, three per day, with the goal of increasing its 4.2 rating to 4.3, which he claimed was necessary in order to have sales. He also wrote that he wanted the product to “stay a five star.” Www.amazonverifiedreviews.com then posted a series of fake five-star reviews praising the pills. The FTC said the reviews made false claims, including that the pills were a powerful appetite suppressant, caused weight loss of up to 20 pounds, and blocked the formation of new fat cells.

The proposed settlement includes a judgement of $12.8 million, to be suspended upon payment of $50,000 to the FTC and certain unpaid income tax obligations. The settlement also bans Cure Encapsulations and Jacobwitz from making weight-loss, fat-blocking, or disease-treatment claims for dietary supplements, food, or drugs, unless they have reliable scientific evidence from clinical trials in humans. They are also prohibited from making misrepresentations about endorsements, including fake reviews, and must tell Amazon which reviews were faked and email customers who have bought the pills to give them information about FTC’s allegations.

In press release, Andrew Smith, director of the FTC’s Bureau of Consumer Protection, said “When a company buys fake reviews to inflate its Amazon ratings, it hurts both shoppers and companies that play by the rules.”

In a statement to The Verge, an Amazon spokesperson said “We welcome the FTC’s work in this area. Amazon invests significant resources to protect the integrity of reviews in our store because we know customers value the insights and experiences shared by fellow shoppers. Even one inauthentic review is one too many. We have clear participation guidelines for both reviewers and selling partners and we suspend, ban, and take legal action on those who violate our policies.”

27 Feb 2019

On the strength of its Mixer partnership, streaming toolkit developer Lightstream raises $8 million

Lightstream, a Chicago-based company which develops tools to augment livestreams, has raised $8 million in new funding as it looks to add monitoring, management, and monetization services to its suite of editing technologies.

Last year, the company inked a partnership with Microsoft‘s live-streaming Twitch competitor, Mixer, to let streamers on the platform add professional flourishes like images, overlays, transitions and text to streams or to edit streams, without a lot of professional editing tools or expertise.

“We got started when Twitch was the only game in town,” says Stu Grubbs, Lightstream’s co-founder and chief executive. “Twitch was the only big name back in 2014 when we started and to be a live streamer you needed to understand bit rates and codex. We set out to make that easier.”

The company works with Twitch, YouTube, and Mixer, but it was when the partnership with Mixer came along that the company’s user base began to explode.

Key to the adoption was Microsoft’s adoption of Beam which lowered the latency on Mixer’s video streams and made that product more compelling to users. Coupled with Microsoft’s reach as the one of the most popular platforms for PC and console gamers, Lightstream’s toolkit gained a powerful, and large user base.

For the past few years, the company has had between 1,000 and 2,000 streamers signing up every week to use its tools. There are now roughly 10,000 streamers on the platform, according to a rough estimate.

Now, with the new money, the company will look to double the size of the team and add some features that have been requested by Lightstream’s growing community of users, Grubbs said.

As a result of the new round, which included a $6 million equity commitment from investors including Drive Capital, MK Capital and Pritzker Group, and a $2 million debt facility from Silicon Valley Bank; Drive Capital General Partner, Andy Jenks, will take a seat on the company’s board of directors.

“Lightstream is an incredible company that has seen tremendous growth because of smart and efficient practices. Stu and his team stand at the convergence of multiple massive and rapidly growing industries,” said Jenks, in a statement. “Stu has immense passion and a keen vision for what they can do for creators and the impact Lightstream can have in live streaming, gaming, and beyond. They have assembled an incredible team, made smart strategic moves, created massive partnerships and are building towards something so big that we had to be a part of it.”

27 Feb 2019

Boeing’s ‘Wingman’ drone buddies up with pilot-flown jets

It’s already tomorrow in Australia, seemingly in more ways than one. It’s the 27th already, yes, but they’re also working in putting together AI-flown companion jets for their fighters. Why didn’t we think of that? It’s a Boeing Australia joint, but maybe they’ll contract out to the U.S. facilities and we can snake one off the line. I know a guy.

The aircraft, currently in development but scheduled for first flight in 2020, is meant to be a loyal wingman to pilots flying military missions — as you might guess from its name, the “Loyal Wingman.” The official full name is the Boeing Airpower Teaming System,” which acronyms to BATS, but they don’t look or act much like bats so this probably won’t be emphasized.

Essentially these are drones that will accompany other craft, flying in formation and providing defensive capabilities. It’s a force multiplier, which is important for governments that can’t field as many pilots or primary craft (i.e. modern fighters) as countries that have invested more heavily in their air force.

Boeing International’s president, Marc Allen, emphasized (naturally) this international-enablement aspect of the craft in a statement:

This aircraft is a historic endeavor for Boeing. Not only is it developed outside the United States, it is also designed so that our global customers can integrate local content to meet their country-specific requirements. The Boeing Airpower Teaming System provides a transformational capability in terms of defense, and our customers – led by Australia – effectively become partners on the program with the ability to grow their own sovereign capabilities to support it, including a high-tech workforce.

In other words, it’s nice to see some investment outside the U.S., diversifying the portfolio a bit.

A full-scale mock-up was revealed at the Australian National Airshow today:

Looks cool.

The Loyal Wingman is 38 feet long and should have a 2,300-mile range. It will fly independently but will almost certainly remotely as well, and can be equipped with a variety of sensor packages and other goodies. I wouldn’t expect these to get into any dogfights, however. They’re meant to be support, providing recon and surveillance duties that can’t be done from, say, a research or cargo craft.

Given the popularity, in military circles anyway, of drones as solo recon, this kind of “extra pair of eyes” duty makes a lot of sense, and seems inevitable. Whether Boeing’s approach will be the one to take off in governments around the world surely depends on the execution, so we’ll revisit this story in 2020 when the Wingman actually takes flight.

27 Feb 2019

Prototype prosthesis proffers proper proprioceptive properties

Researchers have created a prosthetic hand that offers its users the ability to feel where it is and how the fingers are positioned — a sense known as proprioception. The headline may be in jest, but the advance is real and may help amputees more effectively and naturally use their prostheses.

Prosthesis rejection is a real problem for amputees, and many choose to simply live without these devices, electronic or mechanical, since they can complicate as much as they simplify. Part of that is the simple fact that, unlike their natural limbs, artificial ones have no real sensation — or if there is any, it’s nowhere near the level someone had before.

Touch and temperature detection are important, of course, but what’s even more critical to ordinary use is simply knowing where your limb is and what it’s doing. If you close your eyes, you can tell where each digit is, how many you’re holding up, whether they’re gripping a small or large object, and so on. That’s currently impossible with a prosthesis, even one that’s been integrated with the nervous system to provide feedback — meaning users have to watch what they’re doing at all times. (That is, if the arm isn’t watching for you.)

This prosthesis, built by Swiss, Italian, and German neurologists and engineers, is described in a recent issue of Science Robotics. It takes the existing concept of sending touch information to the brain through electrodes patched into the nerves of the arm, and adapts it to provide real-time proprioceptive feedback.

“Our study shows that sensory substitution based on intraneural stimulation can deliver both position feedback and tactile feedback simultaneously and in real time. The brain has no problem combining this information, and patients can process both types in real time with excellent results,” explained Silvestro Micera, of the École Polytechnique Fédérale de Lausanne, in a news release.

It’s been the work of a decade to engineer and demonstrate this possibility, which could be of enormous benefit. Having a natural, intuitive understanding of the position of your hand, arm, or leg would likely make prostheses much more useful and comfortable for their users.

Essentially the robotic hand relays its telemetry to the brain through the nerve pathways that would normally be bringing touch to that area. Unfortunately it’s rather difficult to actually recreate the proprioceptive pathways, so the team used what’s called sensory substitution instead. This uses other pathways, like ordinary touch, as ways to present different sense modalities.

(Diagram modified from original to better fit, and to remove some rather bloody imagery.)

A simple example would be a machine that touched your arm in a different location depending on where your hand is. In the case of this research it’s much finer, but still essentially presenting position data as touch data. It sounds weird, but our brains are actually really good at adapting to this kind of thing.

As evidence witness that after some training two amputees using the system were able to tell the difference between four differently shaped objects being grasped, with their eyes closed, with 75 percent accuracy. Chance would be 25 percent, of course, meaning the sensation of holding objects of different sizes came through loud and clear — clear enough for a prototype, anyway. Amazingly, the team was able to add actual touch feedback to the existing pathways and the users were not overly confused by it. So there’s precedent now for multi-modal sensory feedback from an artificial limb.

The study has well-defined limitations, such as the number and type of fingers it was able to relay information from, and the granularity and type of that data. And the “installation” process is still very invasive. But it’s pioneering work nevertheless: this type of research is very iterative and global, progressing by small steps until, all of a sudden, prosthetics as a science has made huge strides. And the people who use prosthetic limbs will be making strides as well.

26 Feb 2019

Steam fights for future of game stores and streaming

For more than 15 years, Steam has been the dominant digital distribution platform for PC video games. While its success has spawned several competitors, including some online stores from game publishers, none have made a significant dent in its vice-like grip on the market.

Cracks though are seemingly starting to appear in Steam’s armor, and at least one notable challenger has stepped up, with potentially bigger ones on the horizon. They threaten to make Steam the digital equivalent of GameStop —a once unassailable retail giant whose future became questionable when it didn’t successfully change with the times.

The epic launch of an Epic Store

Photo by Neilson Barnard/Getty Images for Ubisoft

Epic Games has, in a remarkably short period of time, positioned itself as the successor to Steam. In December, the creator of the billion dollar Fortnite franchise announced it was getting into the game retail business with the Epic Games store. Less than two months later, it had landed limited exclusivity deals with two publishers who chose to bypass Steam as they launch upcoming titles.

First up was Ubisoft, which announced the PC version of Tom Clancy’s The Division 2, a highly anticipated action game would be semi-exclusive to the Epic Games store (It will also be available on Ubisoft’s digital storefront). Ubisoft also said that “additional select titles” would be coming to Epic’s store in later months.

“We’re giving game developers and publishers the store business model that we’ve always wanted as developers ourselves,” said Tim Sweeney, founder and CEO of Epic Games. “Ubisoft supports our model and trusts us to deliver a smooth journey for players, from pre-purchase to the game’s release.”

Three weeks later, publisher Deep Silver abruptly discontinued pre-sales of its survival shooter Metro Exodus on Steam and announced the game would be available moving forward solely through the Epic Games store (previous Steam orders will be honored).

Steam’s past success is hitting new blocks

To be clear, Steam is hardly struggling. Last October at Melbourne Games Week, Steam announced it had 90 million monthly active users, compared to 67 million in 2017. Daily active users, it said, had grown from 33 million to 47 million.

Much of that growth came from China, where players are looking to circumvent the government’s crackdown on games. Domestic numbers, though, have been trending down, according to SteamSpy, a third-party tracking service.

Valve Software, which owns Steam, did not reply to requests for comment on this story. It did, however, post a statement on the Metro Exodus Steam page soon after Deep Silver announced its partnership with Epic, saying “We think the decision to remove the game is unfair to Steam customers, especially after a long pre-sale period. We apologize to Steam customers that were expecting it to be available for sale through the February 15th release date, but we were only recently informed of the decision and given limited time to let everyone know.”

So what’s the draw for game makers to sell via Epic Games store? It is, of course, a combination of factors, but chief among those is financial. To convince publishers and developers to utilize their system, Epic only takes a 12% cut of game sale revenues. That’s significantly lower than the 30% taken by Valve on Steam (or the amounts taken by Apple or Google in their app stores).

To woo developers who use its Unreal graphics engine, Epic also waives all royalty fees for sales generated through the store. (Developers who use Unreal in their games typically pay a 5% royalty on all sales.)

The reason for those notably lower commissions, perhaps not surprisingly, ties back to Fortnite.

“While running Fortnite we learned a lot about the cost of running a digital store on PC,” says Sweeney. “The math is simple: we pay around 2.5% for payment processing for major payment methods, less than 1.5% for CDN [content delivery network] costs (assuming all games are updated as often as Fortnite), and between 1% and 2% for variable operating and customer support costs. Because we operate Fortnite on the Epic Games launcher on such a large scale, it has enabled us to build the store, run it at a low cost, and pass those savings onto developers.”

Owning the game customer

Photo by Andy Cross/The Denver Post via Getty Images

Higher commissions are just one of the issues developers and publishers have with Steam. While none were willing to go on the record, for fear of retribution from Valve or because they were not authorized to officially speak on their company’s behalf, the complaints generally echoed each other.

26 Feb 2019

Rotten Tomatoes tries to combat trolls with audience rating changes

Rotten Tomatoes is making a couple of changes designed to prevent trolls from attacking films before they’re even released.

The review aggregator (owned by Fandango) recently announced that it will no longer allow users to post comments about a movie before the actually comes out.

This seems like a no-brainer, and it comes less than two weeks before the release of “Captain Marvel” — the latest blockbuster film to be targeted by online commenters who are apparently upset that movies no longer focus exclusively on white male heroes. (Don’t worry, despite this, “Captain Marvel” looks like it’s going to be a big hit for Marvel and Disney.)

“Unfortunately, we have seen an uptick in non-constructive input, sometimes bordering on trolling, which we believe is a disservice to our general readership,” the site says. “We have decided that turning off this feature for now is the best course of action.”

The site also says it’s no longer displaying a “Want to See” score for a movie, supposedly because it was getting confused for the “Audience Score” — which, again, is only displayed after a movie has been released.

“Don’t worry,” Rotten Tomatoes says, “fans will still get to have their say” once the movie is out. So if a bunch of reactionary idiots still think Rotten Tomatoes is the best venue for their rants about SJWs, they’ll get their opportunity — but this will make a little harder for them to affect the buzz around a film before it comes out.

26 Feb 2019

Measuring and benchmarking the four vital signs of SaaS

SaaS metrics should be to a management team what patient vital signs are to an emergency room doctor: a simple set of universally understood numbers that allow a doctor to quickly know how ill a patient is and what needs fixing first.

Heart rate, blood pressure, respiratory rate and temperature are the big four vital signs in the ER. Everyone knows what they are, what they mean, and what good and bad looks like. When a patient is wheeled in, the doctor does not start by asking the EMT, “How exactly are we defining heart rate?” This shared understanding allows for rapid evaluation, then fast, focused action.

Not so much in SaaS, where discussions about definitions are all you hear. There are too many metrics, too many things to measure and too many useful but incompatible ways to measure them. This results in a loss of clarity, comprehension, and — most importantly — comparability across different companies.

At Scale we’ve spent the last 20 years evaluating investments in SaaS and other subscription companies. We have built an internal shared belief of what the Four Vital Signs of SaaS are, and how exactly to measure them. We have opted for simplicity over complexity in selecting these metrics. This has allowed us to benchmark accurately across companies and to know what a realistic version of “good” looks like.

Scale recently launched Scale Studio, an open-to-anyone tool that gives cloud and SaaS companies performance benchmarks based on these vital signs and 20 years of data across more than 300 companies.

The four vital signs of SaaS

The vital signs of SaaS are Revenue Growth, Sales Efficiency, Revenue Churn and Cash Burn. Almost everything that matters about the financial performance of a SaaS business is captured in these four metrics.

Revenue Growth matters because growth is the central purpose of a startup, and thus for an investor the most important driver of if value can be created at all. We have found that at each stage of a company’s development there is a minimum required level of growth below which a startup will struggle to attract venture capital. We’ve analyzed this Mendoza Line for SaaS growth previously on TechCrunch.

Sales Efficiency matters because software at scale is all about distribution, and thus the relationship between dollars invested in sales and marketing and dollars back via revenue is the key determinant of how much value is created per dollar invested. In a perfect world I would call this Distribution Efficiency, because calling it Sales Efficiency tends wrongly to narrow the focus on this metric to just sales, but that ship has sailed.

Revenue Churn matters because as growth slows the impact of churn escalates and provides an upper bound on how big a company can become. More fundamentally, high churn is just the financial evidence of a product that is not delivering value to customers. Products that do not deliver value cannot build value for their investors, which is why my former board colleague at Box, Mamoon Hamid, is right in saying that every company needs a non-financial north star.

And of course, Cash Burn matters because, well, duh — try running a company without it.

Measuring and benchmarking the four vital signs of SaaS

Vital Sign No. 1: Revenue Growth

There are multiple ways to measure revenue and thus Revenue Growth. ARR-based metrics are more forward-looking, but GAAP revenue tends to be calculated more accurately and is thus more comparable across companies. It typically lags ARR by about a quarter, and for simplicity we have not excluded services revenue. The simplest measure of Revenue Growth is the quarterly GAAP revenue run rate compared to the same quarter GAAP revenue one year ago (or a year from now for a forward-growth estimate). We also measure revenue growth using the ARR Growth Rate and a forward-looking measure of ARR growth that we call iCAGR.

We benchmark Revenue Growth by looking at companies at a comparable revenue run rate because revenue growth rates decline fairly predictably as absolute revenue scale increases (as is clear in the chart below). This means that the top quartile Revenue Growth rate of 123 percent at a $20 million revenue run rate would represent bottom quartile growth at a $2 million revenue run rate.

The chart and table below show, for various revenue run rates, which revenue growth rates represent top, median and bottom quartile performance. The Scale Studio data set has 300+ public and private SaaS companies, some of which have become public, many of which have not and most of which have raised at least some venture capital.
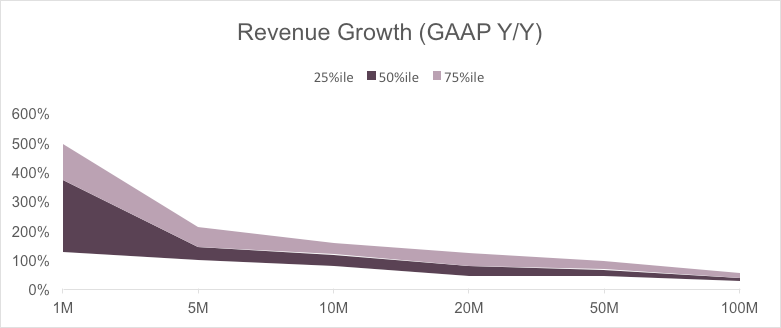
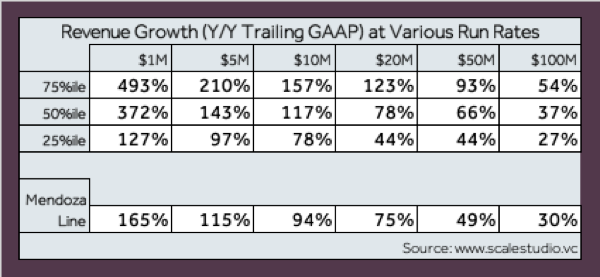
Using this table, a team can quickly benchmark their company’s performance. For example, a company that grew last year 80 percent from $11 million to $20 million is growing at just above 50th percentile growth for SaaS companies at that stage, which is 78 percent. We can also generate a separate table showing the same data on a forward-revenue basis, to allow a company to answer the related question: If I am at a $20 million run rate now, and I grow next year at 50 percent, how will I be doing relative to other SaaS companies?

It is also interesting to see that the data here broadly agrees with a separate calculation we did recently around the Mendoza Line for SaaS growth that tracks at or just above the bottom quartile of growth rate. The Mendoza Line was derived by math; this table was generated from real data — it is good to see both estimates roughly agree.

Another way to look at the same data is to think about the revenue trajectory over time, or “how many years to $100 million.”  The graph and table below show for a consistent top, median or bottom quartile company (at the cutoff points) how long it takes to grow from $1 million to $100 million. A company that grows consistently, just at the top quartile cutoff growth rate, takes six years to get to a $100 million run rate, a median performer takes eight years and a bottom quartile performer does not yet get there in 10 years. This is a calculation with all sorts of survivorship bias problems, because the slow growth companies tend to get acquired and not make it all the way to $100 million, but the analysis is roughly right.
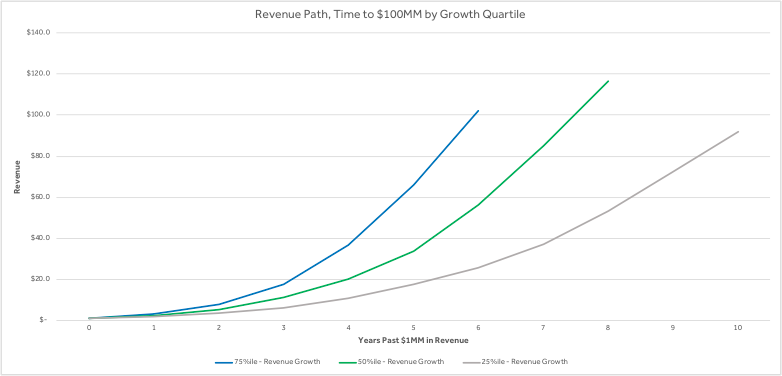
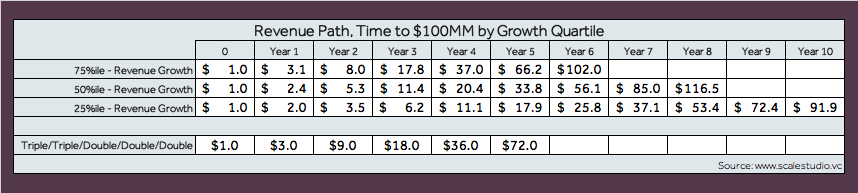
This data also matches well to various rules of thumb. An example is the T2D3 (triple-triple-double-double-double) rule, which is also shown in the table above. T2D3 matches top quartile performance for the first four years and becomes just a little aspirational in year five. If you fail to double from year four to year five and only grow at 90 percent, we would still be glad to talk to you! (The data also roughly matches the Bessemer State of the Cloud Report, which shows an estimate of times to $100 million for best-in-class companies).

Vital Sign No. 2: Sales Efficiency

Sales Efficiency metrics (and again the reminder to think of this more broadly as Distribution Efficiency!) measure the relationship between dollars in (spent on Sales & Marketing) and dollars out (in the form of new revenue). For a recurring revenue business, by far the most intuitive way to measure this concept is by dividing the Gross or Net New ARR for the quarter by the fully loaded Sales & Marketing spend for the same quarter. The Gross SE metric measures the effectiveness of the company in generating new ARR, and the Net SE metric measures the overall effectiveness of the business in both generating and retaining revenue.

We love the simplicity of this calculation and its direct actionability. It can be explained in 30 seconds at a Sales Kick-Off meeting in a way that no other measure can. “We gave you this money, you gave us this ARR.” We are not a fan of putting lags in this method (comparing this quarter’s Net New ARR with last quarter’s S&M spend). There is some logic to the idea that there is lag between spend and results, but once you start to adjust, you end up with all sorts of special pleading. Keep it simple.

For a vital signs diagnosis, we prefer this metric to the complexity of the LTV/CAC calculation. An LTV to CAC works really well for consumer businesses and for B2B businesses that have fairly consistent deal size and low net churn. A former Scale portfolio company, HubSpot, did a brilliant job of orienting their business around this metric. However, for enterprise businesses with highly variable deal sizes and strong positive net cohort growth over time, the calculation becomes arbitrary. The underlying idea is real, namely that enterprise customers can have lower Gross SE but higher ultimate value as the cohorts grow, but trying to track and explain quarterly fluctuations is hard.

Another complexity we choose to avoid is using Gross Margin instead of Revenue. It is of course more correct to use Gross Margin, but especially at the early stages of a SaaS company, Gross Margin fluctuates based on fixed cost recovery issues that significantly distort the calculation.

The problem with an ARR-based Sales Efficiency metric is it doesn’t allow easy comparison across companies. ARR is not reported by public companies and private company ARR numbers are often suspect. Our workaround was to slightly tweak the calculation for Net SE, replacing the numerator (Net New ARR) with the intra-quarter difference in GAAP revenue multiplied by 4 (annualized). We call this formula using GAAP instead of ARR the Magic Number and it should be equal to Net Sales Efficiency with a one quarter lag (to allow ARR to convert to GAAP).

As a rule of thumb: When you’re talking to your team and want to keep it simple, talk Gross and Net Sales Efficiency; when you want to do benchmarking against other companies, use Magic Number.
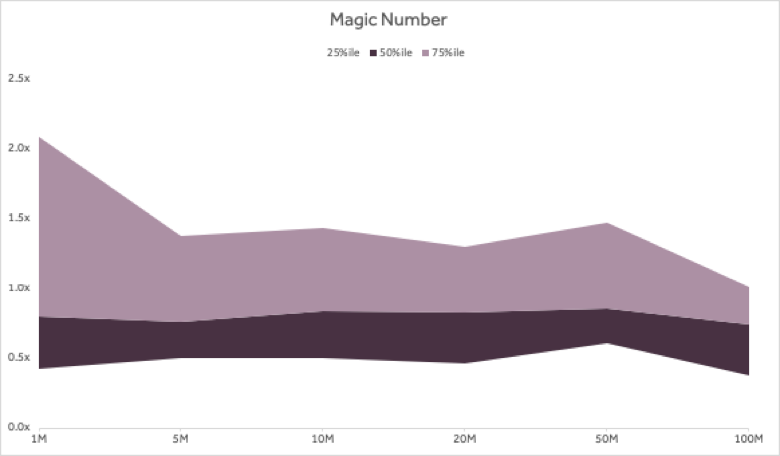
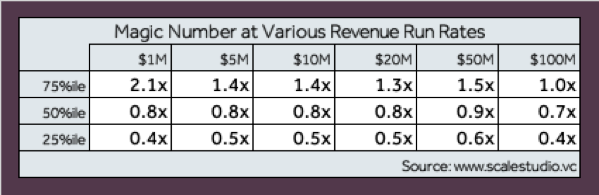
The benchmarking results here are very different. Unlike Revenue Growth, which clearly declines as absolute revenue increases, we have found Sales Efficiency to be fairly consistent across the entire SaaS universe. The median Magic Number for our data set is between .8x and .7x, and the range from top quartile to bottom quartile is between .5x and 1.5x. This matches the public company data set where the median is .7x today.

Payback (on a revenue not a gross margin basis) is simply the inverse of this number, which implies that the average SaaS company is earning back in revenue what it spends in sales and marketing in one divided by .7 years — 17 months — with a top/bottom quartile range of eight months to two years.

We have also observed something that does not come in this table, which is that Sales Efficiency tends to be persistent over time for a given company, especially after $10 million. A good go-to-market model at a $10 million run rate tends to still be a good model at $100 million. And bad sales efficiency at $10 million is hard to change later.

The high top-quartile Magic Number for the $1 million revenue run rate represents an anomaly early on, as often founders are doing the selling themselves (and probably not allocating their costs to Sales & Marketing!). Pretty quickly top quartile Magic Number falls to 1.4x and then to 1.0x at scale.

Vital Sign No. 3: Revenue Churn

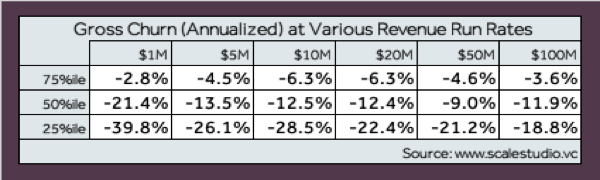
The simplest way to measure Gross and Net Churn is by taking Churned ARR (Gross) and Churned less Upsell ARR (Net) and dividing it by opening ARR for the period, usually a quarter. In the tables below, we show Gross Churn by quarter and annualized.

We acknowledge that this metric is a horrible oversimplification. For the Sales Efficiency calculation above, the simple method is also, we believe, the best method, but for the churn calculation this simplification comes at a significant cost in terms of being able to diagnosis underlying issues. At high growth rates especially, this measure understates actual churn. However, the vital signs framework calls for simplicity to allow consistent, relevant benchmarking across companies. If this simple benchmarking exercise exposes a churn problem, then a deeper dive using retention analysis and a cohort analysis is an absolutely required next step.
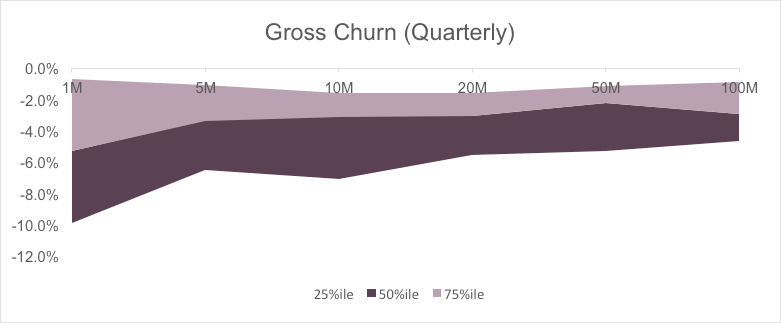
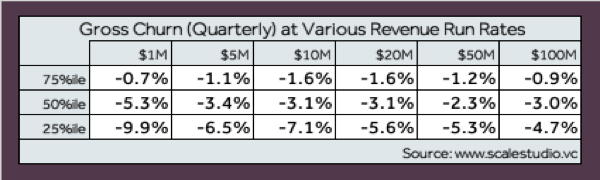
The data above shows Darwinian selection at work. Early on some companies have huge churn but they have to either improve or die. At a $20 million revenue run rate, even bottom quartile companies have annualized Gross Churn hovering around -22 percent.

Vital Sign No. 4: Cash Burn / Operating Income

Internally, we measure cash burn by looking at free cash flow for a quarter (operating cash flow less capex) and compare it to cash on the balance sheet to calculate a cash out date. For confidentiality reasons, we do not ask for cash balances in Scale Studio. A reasonable proxy for cash burn is Operating Income, and the chart and table below show Operating Income as a percent of Revenue at different revenue run rates.

To illustrate what this metric means, at a $20 million revenue run rate the median company in the data set is losing 63 percent of revenue, $12.7 million dollars, or colloquially “burning $1 million a month.” In Scale Studio you can also further benchmark total operating expenses one level down, across each of Gross Margin, Sales/Marketing, R&D and G&A.
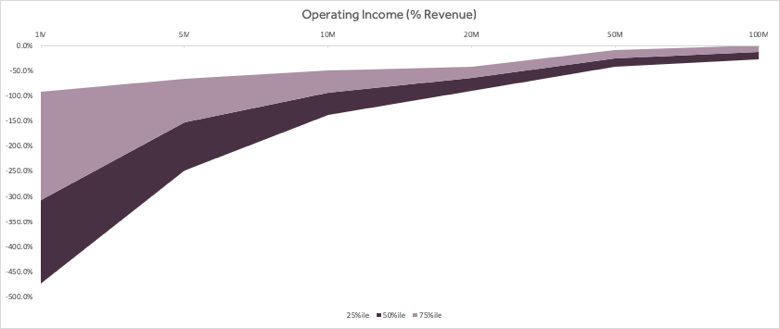
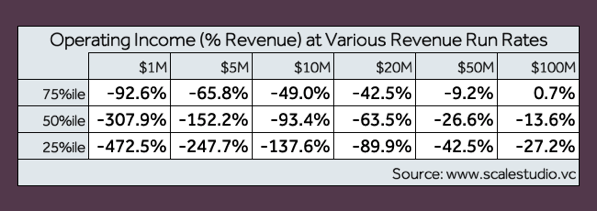
The most important point to make about this metric is that in a recurring revenue business, operating income, or “burn,” however calculated is not a measure of efficiency. Instead it is a measure of how aggressively a company is investing. A high operating loss coupled with a high growth rate and high sales efficiency is an aggressive but probably sensible strategy provided of course the company has access to capital. A high burn, low growth company is a disaster in the making.

Exactly how much burn for exactly how much growth will be the subject for another post, but any comment that tries to link burn rate to value creation, without taking growth rate into account, is simply wrong. Many of the most successful SaaS companies were in the bottom quartile on this metric at $100 million in run rate revenue, but were also in the top quartile on revenue growth. Worth highlighting again is the proviso regarding access to capital. If the cash runs, out even the best business dies.

The very best companies are those such as Veeva and Atlassian where a high Sales Efficiency allowed them to simultaneously be top quartile on growth, and top quartile on operating income profitability. It is no accident that companies with these characteristics get premium public valuations.

What are your company’s vital signs?

Getting started with Scale Studio is simple: you enter nine basic data points for each of your trailing eight quarters then generate a benchmark report. The benchmarks use a sample set consisting of companies at the same revenue stage as yours. This allows for much more accurate benchmarking, especially for Revenue Growth and Operating Income which, as we have said, are a direct function of revenue run rate. The benchmarks give you a sense of your performance that is clear, concise, and comparable. Your report might say something like:

“At your current revenue run rate of $5 million, your Y/Y Revenue Growth rate of 150 percent is in the second quartile for companies of your size, your Magic Number of 0.8 is in the second quartile, your Gross Churn of -1 percent is in the top quartile, and your Operating Income of -152 percent of revenue is in the second quartile.”

Vital signs don’t cure patients, doctors do. SaaS vital signs don’t fix companies, management teams do. But realistic benchmarking metrics do what ER vital signs do: pinpoint issues, provide actionable context and allow you to get to work.

Jeremy Kaufmann contributed to this article.

26 Feb 2019

Mixtape podcast: Tech’s concern for the homeless

Welcome to the latest episode of TechCrunch Mixtape with Megan Rose Dickey and myself. This week we talk about mental illness within the homeless population, specifically how people can help situations that are typically addressed by police.

Neil Shah, CEO of Concrn, joined us in the studio to talk about the ups, downs and ups again of leading an app that lacks the appeal of many Silicon Valley upstarts.

Billed as the “compassionate alternative to 911,” Concrn allows users to report a homeless person who is experiencing distress due to mental illness. Rather than involving 911, a call to Concrn will alert trained employees who are then dispatched to help de-escalate the situation, helping to ensure their safety — and hopefully keep them out of the system.

“I started working in homeless services; I started helping people get jobs,” Shah tells us. “And one of the things I noticed was that certain people from the homeless community were fully capable — they just needed to get connected to services, connected to job opportunities. Get some training.”

The company has experienced some growing pains in its relatively short life. It tried to partner with the San Francisco Police Department last fall, but the partnership never came to fruition.

“We are on pause [in San Francisco] and we have been since December,” Shah says. “I was disheartened at first because I felt like we failed in some ways there. But what I realized more is that for so many different factors, SF actually is not a good place for us to operate right now.”

So the company turned its attention to the smaller city across the bay.

“We feel like the Oakland community was way more open to something like this in general.”

Shah was also on a panel at Disrupt SF about creating a lifeline in communities. Check it out below. And click play above to listen to this week’s episode.

And if you haven’t subscribed to Mixtape yet, what are you waiting for? Find us on Apple PodcastsStitcherOvercastCastBox or whichever other podcast platform you can find.

26 Feb 2019

Porsche’s best-selling Macan SUV is going all-electric

Porsche plans to turn its its best-selling U.S. vehicle, the Macan SUV, into an electric vehicle following the introduction of its first EVs, the Taycan and its crossover cousin, the Cross Tourismo.

Production of the next-generation all-electric Porsche Macan will begin early in the next decade, the company announced Tuesday. It will be produced in Leipzig, Germany, the same factory where the current gas-powered Macan is manufactured.

The Taycan, the company’s first all-electric vehicle, will launch at the end of 2019. The Taycan Cross Turismo will follow shortly afterwards.

Porsche says it decided to turn the next-generation Macan into an electric vehicle because it creates the “opportunity to produce fully electric vehicles on the existing production line.”

It’s also a bet on U.S. drivers. The Macan compact crossover was Porsche’s best-selling vehicle in the U.S. The company delivered more than 23,500 Macan SUVs in 2018, up 9.7 percent from the previous year.

The Macan compact SUV will also feature 800-volt architecture, just like the Taycan. This will allow the vehicle to take a 350 kW charge, which translates to about 60 miles of range in just four minutes on certain fast chargers.

The model will be based on the PPE architecture (Premium Platform Electric) developed in collaboration with Audi AG, according to Porsche.

“Electromobility and Porsche go together perfectly; not just because they share a high-efficiency approach, but especially because of their sporty character,” Porsche AG Board Chairman Oliver Blume said in a statement.

Blume added that the company plans to investment more than 6 billion euros, or more than $6.8 billion, by 2022 into “electric mobility.” By 2025, 50 percent of all new Porsche vehicles could have an electric drive system, Blume said.

Porsche isn’t backing away from gas-powered vehicles altogether. At least in the short term.

Over the next decade, the company “will focus on a drive mix consisting of even further optimized petrol engines, plug-in hybrid models, and purely electrically operated sports cars,” Blume said. “Our aim is to take a pioneering role in technology, and for this reason we will continue to consistently align the company with the mobility of the future.”

26 Feb 2019

Zone 7 raises $2.5 million seed round to predict injury risk for athletes

Zone7, the company using data and analytics to identify the potential for injuries with athletes, has raised $2.5 million in seed funding.

The company monitors athletes performance to determine when they need to be rested to avoid the potential for career threatening injuries.

The company’s technology has managed to attract investors including Resolute Ventures, UpWest, Amicus Capital, Dave Pell, PLG Ventures, along with athletes like the National Basketball Association star Kristaps Porzingis.

Teams in the MLB, La Liga, Champions League, MLS, collegiate athletic departments and Olympic teams are all using the company’s technology, according to a statement.

“Getting injured is one of the worst experiences for any athlete,” said Porzingis, in a statement. “The technology behind Zone7 is extremely impressive and has the potential to change the landscape of sports forever.”

Zone7 uses pattern recognition based on an athlete’s past performance and medical history to determine what course of action is best for the player to ensure that they don’t get hurt. So far, the company says it has achieved a 95% accuracy rate when it comes to predicting injuries and reduced the potential for injuries by 75%, according to a statement.

“Injuries in professional sports cost billions annually, but in the era of big data it doesn’t have to be that way,” said Tal Brown, co-founder and CEO of Zone7. “Professional sports franchises have massive amounts of untapped health and performance data that, when unlocked by AI, can become one of a team’s most valuable assets. By better understanding every athlete’s breaking points and implementing personalized intervention plans to prevent injuries before they occur, teams no longer have to accept injuries as an inevitability.”

Founded by Tal Brown and Eyal Aliakim, two Israelis who served in the military’s elite technology division called the 8200, Zone7’s executive team has years of experience working with Salesforce on the development of its Einstein product and with professional soccer franchises in Israel.

“Professional sports is, for the most part, slow to embrace medical and performance data, and as such, this has historically been a difficult target market to break into. Tal and Eyal have built a compelling product that is making teams stand up and take notice. It’s literally a game changer,” said Raanan Bar-Cohen, general partner at Resolute Ventures, in a statement. “The fact that Zone7 is the first company to show injuries can be avoided by using artificial intelligence, makes us extremely excited to partner with the Zone7 team.”